Dashboarding and analytics inspection software
Monitor what is happening in your company in real time
The business intelligence module brings visibility on the information collected during inspections or incidents creation
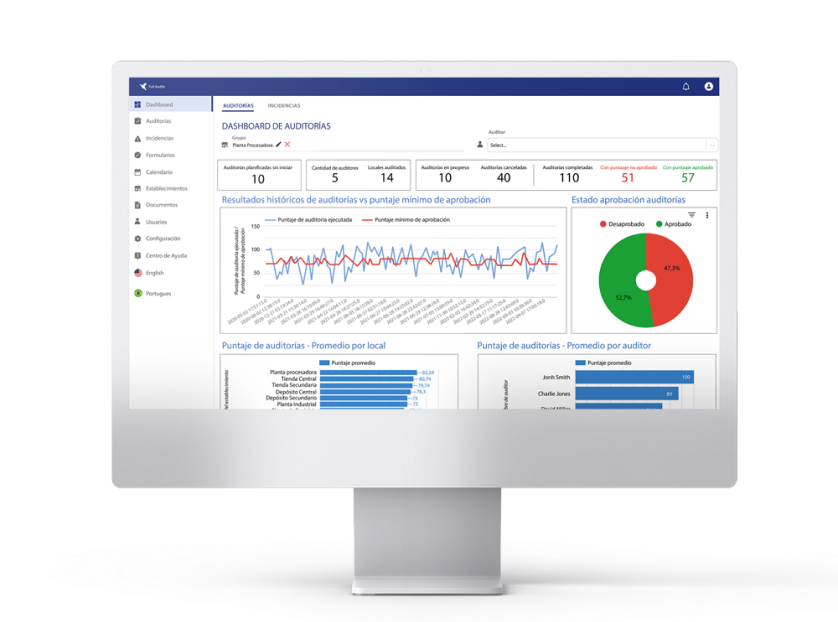
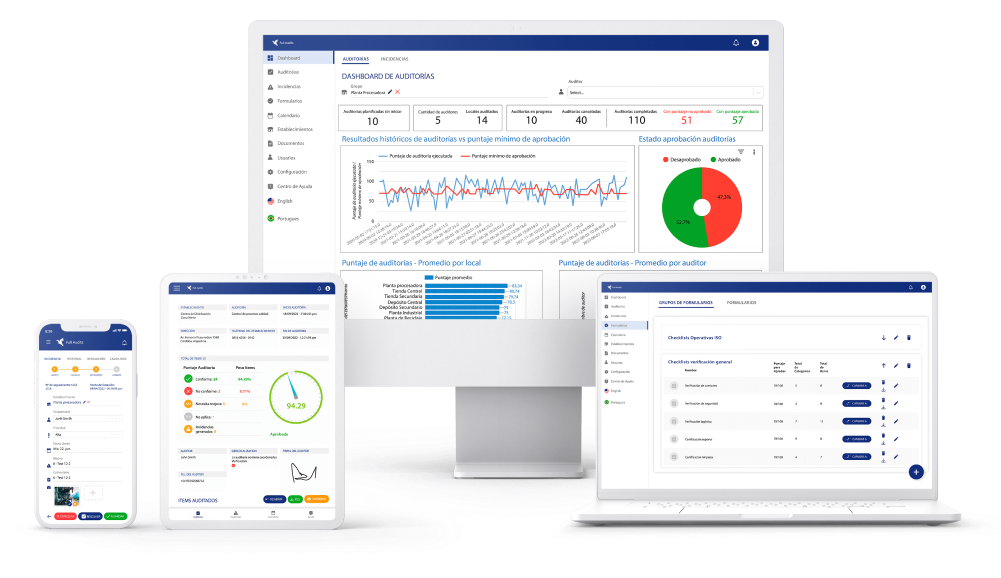
Inspections Dashboard
- Historical Audit Results vs Minimum Approval Score
- Inspection Approval Status
- Inspection Score - Average per store
- Inspection Score - Average per auditor
- Number of inspections executed per store
- Number of Inspections Executed per Auditor
- Number of Cancelled Inspections per Store
- Number of Cancelled Inspections per Auditor
- Inspection Deviation From Planned Start Date
- Rating of Total Audited Items
- Detail of Completed Inspections
- Most Frequent Need Improvement Items
- Most Frequent Not Compliant Items
- Allows filtering by date, store, auditors and checklists

All data will be available immediately and will show valuable information that will allow you to make business decisions.
Dashboards will give you visibility about the status of the quality process in the organization and will allow you to identify where to focus in order to improve and make business decisions.
Incidents Dashboard
- Incidents Status
- Incidents Status and Due Date
- Open Incidents per Store
- Closed Incidents per Store
- Most Frequent incidents Ranking
- Open Incidents per Priority
- Closed Incidents per Priority
- Open Incidents per User
- Closed Incidents per User
- Historical Incidents Total
- Number of Incidents created per Priority
- Number of Incidents created per User
- Number of Incidents created per Store
- It allows filtering by date, store, incident responsible and priority.
Preguntas frecuentes
¿Qué es un dashboard analítico?
El dashboard analítico es un tipo de tablero que proporciona a una empresa u organización una visión general e integral de una gran cantidad de datos, los cuales estarán disponibles de forma inmediata.
A través de esta visualización, podrás realizar un análisis correcto y claro de aquellos datos que se generaron. También podrás crear informes en tiempo real y compartir información con otras personas.
¿Qué muestra un dashboard?
Un dashboard mostrará información de valor que permitirá a la persona indicada tomar decisiones convenientes. Además, le dará visibilidad acerca del estado del proceso de calidad en la organización y de forma muy simple, le permitirá identificar dónde hacer foco para mejorar y tomar decisiones.
¿Qué es un dashboard de ventas?
El dashboard de ventas es una representación visual de todos tus datos de ventas. Está compuesto por métricas o KPI´s (key performance indicators) que se consideran relevantes para la empresa.
Entre los indicadores más importantes podemos nombrar los siguientes:
- Ventas realizadas hasta el momento.
- Ventas por región.
- Ventas por representante.
- Tasa de conversión de leads.
- Valor de compra medio.
- Porcentaje de cotización para cierre.
- Oportunidades
¿Cómo se hace un dashboard?
Para construir un dashboard debes ir desde lo particular hacia lo general. Por lo tanto, debes:
- Lograr una visión general de lo que quieres lograr.
- Conocer los datos y la relación que existe entre ellos.
- Configurar los datos correctamente, es decir, modelarlos para poder realizar gráficos coherentes.
- Evaluar qué tipo de gráficos se utilizarán para mostrar los datos de la forma más clara posible.
- Probar la funcionalidad del dashboard.
- Definir el modo de visualización.
Success stories
Clients that implemented Full Audits on their organizations
“I recommend Full Audits because it is very practical, easy to use and the benefits for the final user are great. It counts with an excellent service and very good predisposition from the team. Among its benefits, I highlight the management of improvement opportunities or incidents, the immediate response to problems and the practicality for the auditor. “
Diego Alcaraz
Operational Supervisor
Solintar
“The greatest benefits that the implementation of Full Audits brings us are the automatic data consolidation and the easy-to-read reports generated. It is user-friendly too.”
Martina Serrano Fuster
Quality Manager
Cono Group
“I highly recommend Full Audits because of the flexibility and cost offered for the management of any type of audit or project follow-up. The support of all the staff has been very professional, regardless of the schedule, I have always received punctual and timely attention.
Its implementation allowed us to achieve greater efficiency in the execution of audits and follow-up of action plans, more certainty and reduction in inspection reporting time and an executive analysis of findings that allow assertive decision making. “
Rodrigo Bedolla
Quality Manager at Witzenmann Metal Products Mexico S.A. de C.V.
Witzenmann
“Full Audits is easy to use and allows us to generate reports in real time. It is very simple to collect information, including images in the field. We save a lot of time in the preparation of reports after the audit or inspection that we carry out in the facilities of our clients. It also allowed us to optimize findings and improvements opportunities management that we detect in each intervention of our consultancy.”
Carlos E. Quattrini
CEO Jensen Quattrini
JensenQuattrini
“The application is agile, complete and allowed us to collect different types of evidence in a short time. It is easy to adapt to different processes, it is quick to implement and it is very useful to receive the report with statistics at the time the audit is completed”
Claudia Lacon
Supplier Quality Auditor
Bodega TRIVENTO Argentina

